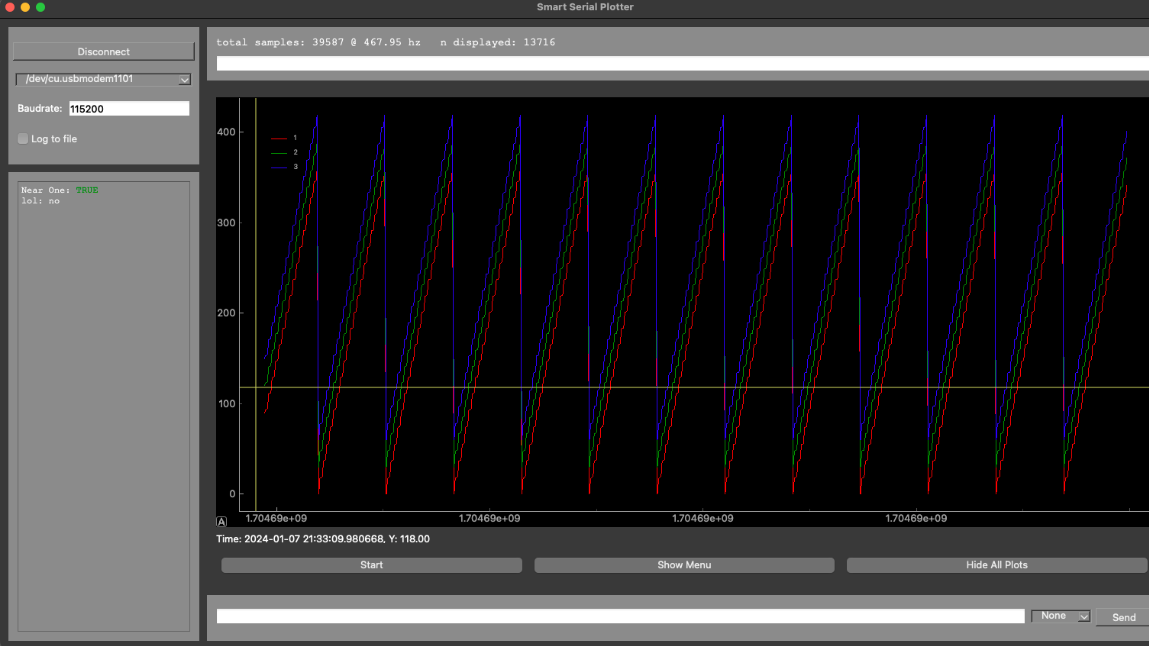
Somewhere between “my sensor works!” and “why does this line look like a caffeinated squirrel?” every maker, robotics tinkerer, electronics student, and embedded developer meets the same problem: serial data is easy to print, but surprisingly annoying to understand. A stream of numbers in a serial monitor is technically information, in the same way a grocery receipt is technically literature. Useful? Yes. Pleasant to read at high speed? Absolutely not.
That is where a serial data plotter comes in. Instead of staring at a waterfall of values from an Arduino, ESP32, Raspberry Pi Pico, custom microcontroller board, GPS receiver, IMU, temperature sensor, motor controller, or lab prototype, a plotter turns those numbers into live graphs. Suddenly, noise looks like noise. Drift looks like drift. A broken wire looks like a flat line. And your “perfect” PID loop reveals itself as a tiny mechanical panic attack.
There are already tools for this. The Arduino IDE includes a Serial Plotter. VS Code has serial monitor extensions. PlotJuggler is powerful for time-series visualization. Python developers can combine pySerial with Matplotlib or PyQtGraph. Browser fans can use the Web Serial API. So why would anyone write their own serial data plotter?
Because eventually, your project becomes just weird enough that a generic tool stops fitting. You need custom labels, multiple channels, a rolling buffer, export buttons, calibration math, timestamps, alerts, protocol parsing, or one tiny checkbox that says “hide the cursed vibration channel.” At that moment, writing your own plotter stops being overkill and starts being self-defense.
What Is a Serial Data Plotter?
A serial data plotter is a program that reads incoming serial data from a device and displays it as a graph in real time. Most embedded boards can send text over USB serial using simple commands like Serial.print() or Serial.println(). A plotter listens to that stream, parses the values, and draws them as lines, bars, gauges, or dashboards.
In the simplest case, your microcontroller prints one number per line:
A plotter reads each line and adds a new point to a scrolling graph. If your board prints multiple comma-separated values, the plotter can draw multiple lines:
That tiny formatting decision changes everything. Now you can compare sensor channels, test filters, watch warm-up behavior, tune thresholds, or prove that the “random spike” happens exactly when the motor starts. Numbers become behavior. Behavior becomes diagnosis. Diagnosis becomes fewer late-night debugging snacks.
Why Existing Serial Plotters Are GreatUntil They Are Not
Built-in tools are excellent for quick experiments. Arduino’s Serial Plotter is convenient because it is already inside the Arduino IDE and can graph variables from serial output. For basic sensor testing, calibration, and waveform viewing, it is often enough. You upload a sketch, open the plotter, and there it is: your data, wiggling politely across the screen.
The trouble begins when your project wants more structure. Maybe you need to record every sample to CSV while plotting only the last 30 seconds. Maybe your device sends packets with checksums. Maybe each line includes a timestamp, status flag, and three sensor values. Maybe the built-in autoscaling makes your graph jump around like it heard a scary noise. Generic plotters usually aim to be simple. Your project, because it has no respect for your weekend, does not.
Common Limitations of Off-the-Shelf Serial Plotters
The most common limitation is parsing. Many tools expect clean numeric rows. Real devices often send mixed output: debug messages, boot logs, warnings, labels, blank lines, and occasional nonsense when the baud rate is wrong. A custom plotter can ignore non-data lines, validate packets, handle missing values, and keep running instead of fainting dramatically at the first malformed byte.
Another limitation is control. You may want fixed y-axis ranges, smoothing options, color-coded channels, event markers, trigger capture, or a pause button that does not disconnect the port. A custom serial plotter lets you design the interface around your workflow instead of reshaping your workflow around someone else’s interface.
Finally, there is data ownership. A homemade plotter can save exactly what you need: raw logs, parsed CSV, timestamps from the host computer, device uptime, metadata, calibration settings, firmware version, and notes. That is incredibly useful when a test works once, fails later, and you need to know what changed besides your mood.
When You Should Write Your Own Serial Data Plotter
You do not need to write your own plotter for every project. If you are checking whether a potentiometer changes from 0 to 1023, use the built-in tool and enjoy your free time. But if your serial stream is central to development, testing, or analysis, a custom plotter can pay for itself quickly.
Write your own serial data plotter when you need multiple named signals, long-running logging, custom scaling, special packet formats, repeatable experiments, or a dashboard for other people. This is especially true in robotics, environmental sensing, battery testing, motor control, audio experiments, machine monitoring, and classroom labs where visual feedback helps people understand what the hardware is doing.
A custom tool is also worth it when you need reliability. During a five-minute demo, a simple plotter is fine. During an overnight sensor test, you need reconnection handling, file writing, memory limits, and timestamps that do not wander off into the bushes.
The Best Stack for a DIY Serial Data Plotter
There is no single perfect stack. The best choice depends on whether you want speed, simplicity, portability, or a polished interface. Here are the most practical options.
Python: The Fastest Way to Build Something Useful
Python is usually the friendliest starting point. The pySerial library handles serial port communication across major desktop platforms, while Matplotlib, PyQtGraph, or similar libraries handle visualization. For a quick prototype, Python is hard to beat. You can open a port, read lines, split values, append them to a buffer, and update a graph in fewer lines than it takes to explain why your desk has six USB cables and none of them are the right one.
A typical Python plotter architecture looks like this: one part reads serial data, one part parses it, one part stores recent samples, and one part updates the display. Keep those pieces separate. Future you will appreciate it when you need to change the input format without rewriting the graph.
Matplotlib: Great for Simple Live Graphs
Matplotlib is a strong choice for quick plotting, especially if you already use Python for analysis. Its animation tools can update a chart repeatedly, making it suitable for basic live visualization. The upside is familiarity. The downside is that very high update rates can feel sluggish if you redraw too much too often.
For many sensor projects, that is not a problem. Temperature, humidity, light, voltage, and slow mechanical signals do not need cinematic frame rates. A clean Matplotlib plot updating several times per second can be perfectly usable.
PyQtGraph: Better for Fast, Interactive Dashboards
If you want smoother real-time performance, PyQtGraph is often a better fit. It is designed for fast scientific plotting and interactive graphics. That makes it attractive for signals that update quickly, such as accelerometer data, motor current, vibration, or control-loop telemetry.
The trade-off is complexity. Building a proper GUI with Qt takes more structure than a small Matplotlib script. But once you need buttons, dropdowns, channel visibility toggles, logging controls, and a responsive window, that structure becomes a blessing rather than a burden.
Browser-Based Plotters: Surprisingly Practical
The Web Serial API allows supported browsers to communicate with serial devices directly from a web page. That opens the door to a serial plotter built with HTML, JavaScript, Canvas, SVG, or D3. The big advantage is distribution: users can open a page instead of installing a desktop application.
Browser-based plotters are especially appealing for educational kits, demos, and internal tools. You can design a clean interface, add instructions, and let people connect their device from the page. The caution is compatibility. Browser support and permission rules matter, so this approach should be tested on the actual systems your audience will use.
Processing: Still Useful for Visual Experiments
Processing remains a friendly environment for visual sketches and hardware interaction. Its serial library can read and write data from external devices, and it is approachable for artists, students, and educators. If your plotter is more of an interactive visual instrument than a formal engineering dashboard, Processing can still be a fun and productive choice.
Designing a Serial Format That Will Not Betray You
The plotter is only half the story. The serial format coming from your device matters just as much. A beautiful desktop application cannot save a chaotic data stream that changes format every twelve seconds because someone added “just one more debug print.”
The easiest format is newline-delimited CSV. Print one sample per line. Use commas between values. Include a header row if possible. Keep debug text either disabled or clearly prefixed so the parser can ignore it.
For more advanced projects, JSON lines can be easier to extend:
JSON is more verbose, but it gives you named fields and flexible structure. CSV is compact and simple. Binary packets are efficient but require more careful parsing and debugging. Choose the format based on your project’s needs, not on which one sounds more impressive in a meeting.
Rules for a Good Serial Data Format
A good serial format is predictable, documented, and boring. Boring is wonderful. Boring means your plotter can parse it at 1 a.m. without developing trust issues. Use consistent units, consistent field order, clear delimiters, and a newline at the end of every sample. Avoid mixing human-readable debug messages into the same stream unless your parser knows how to skip them.
Features Your Homemade Serial Plotter Should Include
Start small, then add features only when the need is real. The first version should connect to a port, set a baud rate, read lines, parse numbers, and draw a scrolling graph. That is enough to prove the idea.
After that, the most useful features are usually a pause button, automatic reconnect, CSV export, visible channel names, fixed or automatic axis scaling, adjustable history length, and a status panel showing port, baud rate, sample count, and parse errors.
For more serious work, add session recording. The plot is helpful while testing, but the log file is what saves you later. A good plotter should let you reproduce what happened after the device is unplugged, the test bench is cleaned up, and everyone suddenly claims the bug was “probably electrical.”
Do Not Forget Error Handling
Serial communication is messy. Devices disconnect. Ports change names. Bytes arrive late. Lines get chopped. Users pick the wrong baud rate. Your plotter should fail gently. Show clear messages like “no data received,” “parse error,” or “device disconnected.” Do not punish users with mysterious stack traces unless your target audience enjoys emotional obstacle courses.
A Simple Example Workflow
Imagine you are testing a temperature controller. Your microcontroller reads a thermistor, calculates a filtered temperature, and drives a heater using PWM. You want to see raw temperature, filtered temperature, target temperature, and heater output.
Your device prints:
Your plotter reads the header and automatically creates four channels. It uses time_ms for the x-axis. It draws temperature signals on one graph and PWM on another. It logs every row to a CSV file. When the heater overshoots, you can see whether the raw sensor spiked, the filter lagged, or the control logic stayed too aggressive for too long.
That is the magic of a custom serial data plotter. It does not merely show data. It shows the data in the shape your question requires.
Performance Tips for Real-Time Serial Plotting
Live plotting can become slow if you redraw everything on every sample. Use a rolling buffer instead of storing unlimited points in memory. Update the graph at a fixed display rate, such as 10 to 30 frames per second, even if serial samples arrive faster. Your eyes do not need 1,000 redraws per second, and your CPU has other hobbies.
Separate reading from rendering. A background thread, asynchronous task, or timer can collect serial data while the interface updates at a steady pace. This keeps the plot responsive when the device sends bursts of data.
Also, avoid parsing formats that are more complex than necessary. If your microcontroller is sending high-rate data, CSV or binary packets may be better than verbose JSON. If your data rate is low, readability may matter more than efficiency. Engineering is the art of choosing which inconvenience you prefer.
Security and Safety Notes for Browser Plotters
Browser-based serial tools are convenient, but they should be designed responsibly. The user should clearly choose the device, understand what the page will access, and be able to disconnect. Avoid silently sending commands to hardware. A plotter that only reads data is simpler and safer than one that can also control outputs.
If your plotter is used in classrooms or public demos, make the interface obvious. Label the connect button, show the selected port status, and provide plain-language troubleshooting. The goal is to make hardware feel less mysterious, not to create a web app that behaves like a haunted control panel.
Testing Your Serial Data Plotter Without Hardware
One smart move is to build a fake data source. Your plotter should be able to read from a simulated stream that generates sine waves, random noise, ramps, or sample CSV lines. This lets you test the interface without plugging in a board.
A simulator is also useful for demos. Hardware has an incredible sense of timing and often fails when people are watching. A fake serial stream lets you keep developing the plotter even when the real device is on another desk, out of battery, or currently pretending USB does not exist.
Real-World Experience: Lessons From Building Your Own Serial Data Plotter
The first lesson is that the graph is never the hard part for long. At the beginning, you may think the project is about drawing lines. Soon, you realize it is about managing imperfect data. A real serial stream has startup messages, partial lines, pauses, duplicate samples, and the occasional character that looks like it escaped from a corrupted treasure map. The sooner your plotter treats messy input as normal, the happier you will be.
The second lesson is that labels matter more than expected. A graph with three lines named “value1,” “value2,” and “value3” is only slightly better than a mystery novel with all the characters named Dave. Use headers. Display channel names. Show units. When you come back to a test file two weeks later, “battery_v” and “motor_current_a” will save you from archaeological guesswork.
The third lesson is that autoscaling is both helpful and suspicious. Autoscale makes early testing easy, but it can hide important changes or make stable signals look dramatic. A tiny noise ripple can fill the whole chart, causing unnecessary panic and possibly a theatrical sigh. Good plotters offer both automatic and fixed scales. For control systems, fixed scales often make behavior easier to compare across runs.
The fourth lesson is to log raw data even when the plot looks perfect. Especially then. A live graph is temporary; a file is evidence. Save raw lines or parsed values with timestamps. Include the port, baud rate, software version, and any calibration settings. When a sensor test produces a beautiful curve, you will want to keep it. When it produces nonsense, you will want proof that the nonsense was real and not just your imagination wearing safety goggles.
The fifth lesson is that buttons multiply. You start with Connect and Disconnect. Then you add Pause. Then Clear. Then Save. Then Auto Scale. Then Export. Then “Only Show Last 60 Seconds.” Suddenly your simple plotter has become a cockpit. The trick is to add features in response to actual friction. If a button saves time every session, keep it. If it exists because it sounded cool at midnight, maybe let it remain a dream.
The sixth lesson is to respect the sampling rate. For slow sensors, almost any approach works. For faster data, careless plotting can choke. Do not redraw thousands of points more often than necessary. Keep a bounded buffer. Decimate or downsample for display when needed. Store full-resolution data to disk if it matters, but do not force the screen to paint every sample like it is being paid by the pixel.
The seventh lesson is that your future users may not be programmers. Even if the plotter starts as a personal tool, someone else may eventually use it: a teammate, student, technician, customer, or friend who just wants to see whether the sensor is alive. Clear error messages, sensible defaults, and a simple setup flow matter. “Could not parse line 238” is more useful than “Exception in thread,” and “Check baud rate” is friendlier than a silent blank graph.
Finally, building your own serial data plotter teaches you to think about instrumentation. You stop treating serial output as an afterthought and start designing it as part of the system. That habit improves firmware, testing, documentation, and debugging. A good plotter is not just a window into your project. It is a conversation with your hardware, and for once, the hardware uses complete sentences.
Conclusion: Build the Tool Your Project Actually Needs
A serial data plotter is one of those tools that seems small until it changes how you debug. The moment you can see live sensor behavior, timing problems, noise, drift, spikes, and control responses, your project becomes easier to understand. Existing plotters are excellent for quick checks, but a custom plotter gives you control over parsing, display, logging, scaling, and workflow.
If your serial data is simple, use a built-in tool and move on. If your project has multiple channels, custom formats, long tests, or repeatable experiments, writing your own serial data plotter is not just a fun side quest. It is a practical upgrade. And unlike many tools in electronics, this one does not require another mysterious adapter from the bottom drawer.