If your business numbers feel like a junk drawer full of receipts, half-finished spreadsheets, and one calculator held together by hopegood news.
Learning how to write an income statement brings order to the chaos. An income statement (also called a profit and loss statement or P&L) shows whether your business made money over a period of time.
It tells a clean financial story: what came in (revenue), what went out (expenses), and what remained (net income).
This guide walks you step by step through the process in plain American English, with practical examples, formulas, and sanity checks that keep your numbers accurate.
You’ll learn how to choose the right format, categorize costs correctly, avoid common mistakes, and create a statement lenders, investors, and your future self can trust.
Whether you run a side hustle, a local service company, an e-commerce store, or an early-stage startup, this is the blueprint.
Why an Income Statement Matters
An income statement is more than a tax-season chore. It is a decision tool. It helps you answer:
- Are we actually profitable, or just busy?
- Which products/services have healthy margins?
- Are operating expenses growing faster than revenue?
- Can we afford to hire, expand, or invest in marketing?
- What story do our numbers tell to lenders or investors?
Think of it as your business movie trailer. The balance sheet is the full cast list, cash flow is the behind-the-scenes logistics, and the income statement is the “Did this release make money?” headline.
Before You Start: Gather the Right Inputs
Writing a great income statement starts before line one. You need clean inputs. If your books are messy, your income statement becomes a beautifully formatted misunderstanding.
Checklist
| What to Prepare | Why It Matters | Quick Tip |
|---|---|---|
| Reporting period (month/quarter/year) | Defines the time window for all revenue and expense activity | Use monthly statements for management, quarterly for trend review, annual for formal reporting |
| Trial balance or general ledger totals | Source data for every line item | Close books first; don’t mix open and closed periods |
| Revenue detail by stream | Improves analysis and decision-making | Split product sales, subscriptions, services, and other income |
| COGS data (if applicable) | Required to calculate gross profit | Include direct materials, direct labor, and freight-in where appropriate |
| Operating expense breakdown | Shows efficiency of core operations | Keep payroll, rent, software, advertising, insurance, utilities separate |
| Non-operating items | Prevents distortion of core operating performance | Track interest, gains/losses, and unusual items separately |
| Tax estimate | Needed for net income accuracy | Coordinate with accountant for period-appropriate tax treatment |
Step 1: Choose Your Income Statement Format
You typically have two formats:
Single-Step Income Statement
One big subtraction: Total Revenues − Total Expenses = Net Income.
It’s simple, quick, and popular for very small businesses.
Multi-Step Income Statement
More detailed and more useful for analysis:
- Revenue
- − Cost of Goods Sold (COGS)
- = Gross Profit
- − Operating Expenses
- = Operating Income
- ± Non-operating Items
- = Pre-tax Income
- − Income Tax Expense
- = Net Income
If you want management insight (and fewer “where did our margin go?” meetings), choose multi-step.
Step 2: Define the Reporting Period and Accounting Basis
Pick a clear period (for example, January 1–January 31, 2026). Then confirm accounting basis:
- Accrual basis: recognizes revenue when earned and expenses when incurred.
- Cash basis: recognizes transactions when cash moves.
Don’t mix bases in the same statement. That is the accounting equivalent of wearing one ski boot and one flip-flop.
Step 3: Calculate Total Revenue
Start with gross sales/revenue and subtract returns, allowances, or discounts if relevant.
Then add other operating revenue streams.
Revenue Formula
Net Revenue = Gross Revenue − Returns/Allowances − Discounts
If you run multiple business lines, break them out. Example:
- Product Sales
- Service Revenue
- Subscription Revenue
- Other Operating Revenue
Granular revenue categories make your statement more useful for strategy, pricing, and forecasting.
Step 4: Calculate COGS and Gross Profit
If you sell physical productsor any offering with direct production costscalculate COGS carefully.
Typical COGS components include direct materials, direct labor, and manufacturing or fulfillment costs directly tied to units sold.
COGS Formula (Common)
COGS = Beginning Inventory + Purchases − Ending Inventory
Gross Profit Formula
Gross Profit = Net Revenue − COGS
Gross margin tells you if your core offer is economically viable before overhead.
If gross margin is thin, scaling may only scale your stress.
Step 5: Subtract Operating Expenses
Operating expenses are the costs of running the business, excluding direct production costs.
- Salaries and wages (non-production staff)
- Rent and utilities
- Software and subscriptions
- Marketing and advertising
- Insurance
- Office expenses
- Depreciation and amortization
Operating Income Formula
Operating Income = Gross Profit − Operating Expenses
This line is powerful. It shows profit generated by your core business model before financing and taxes.
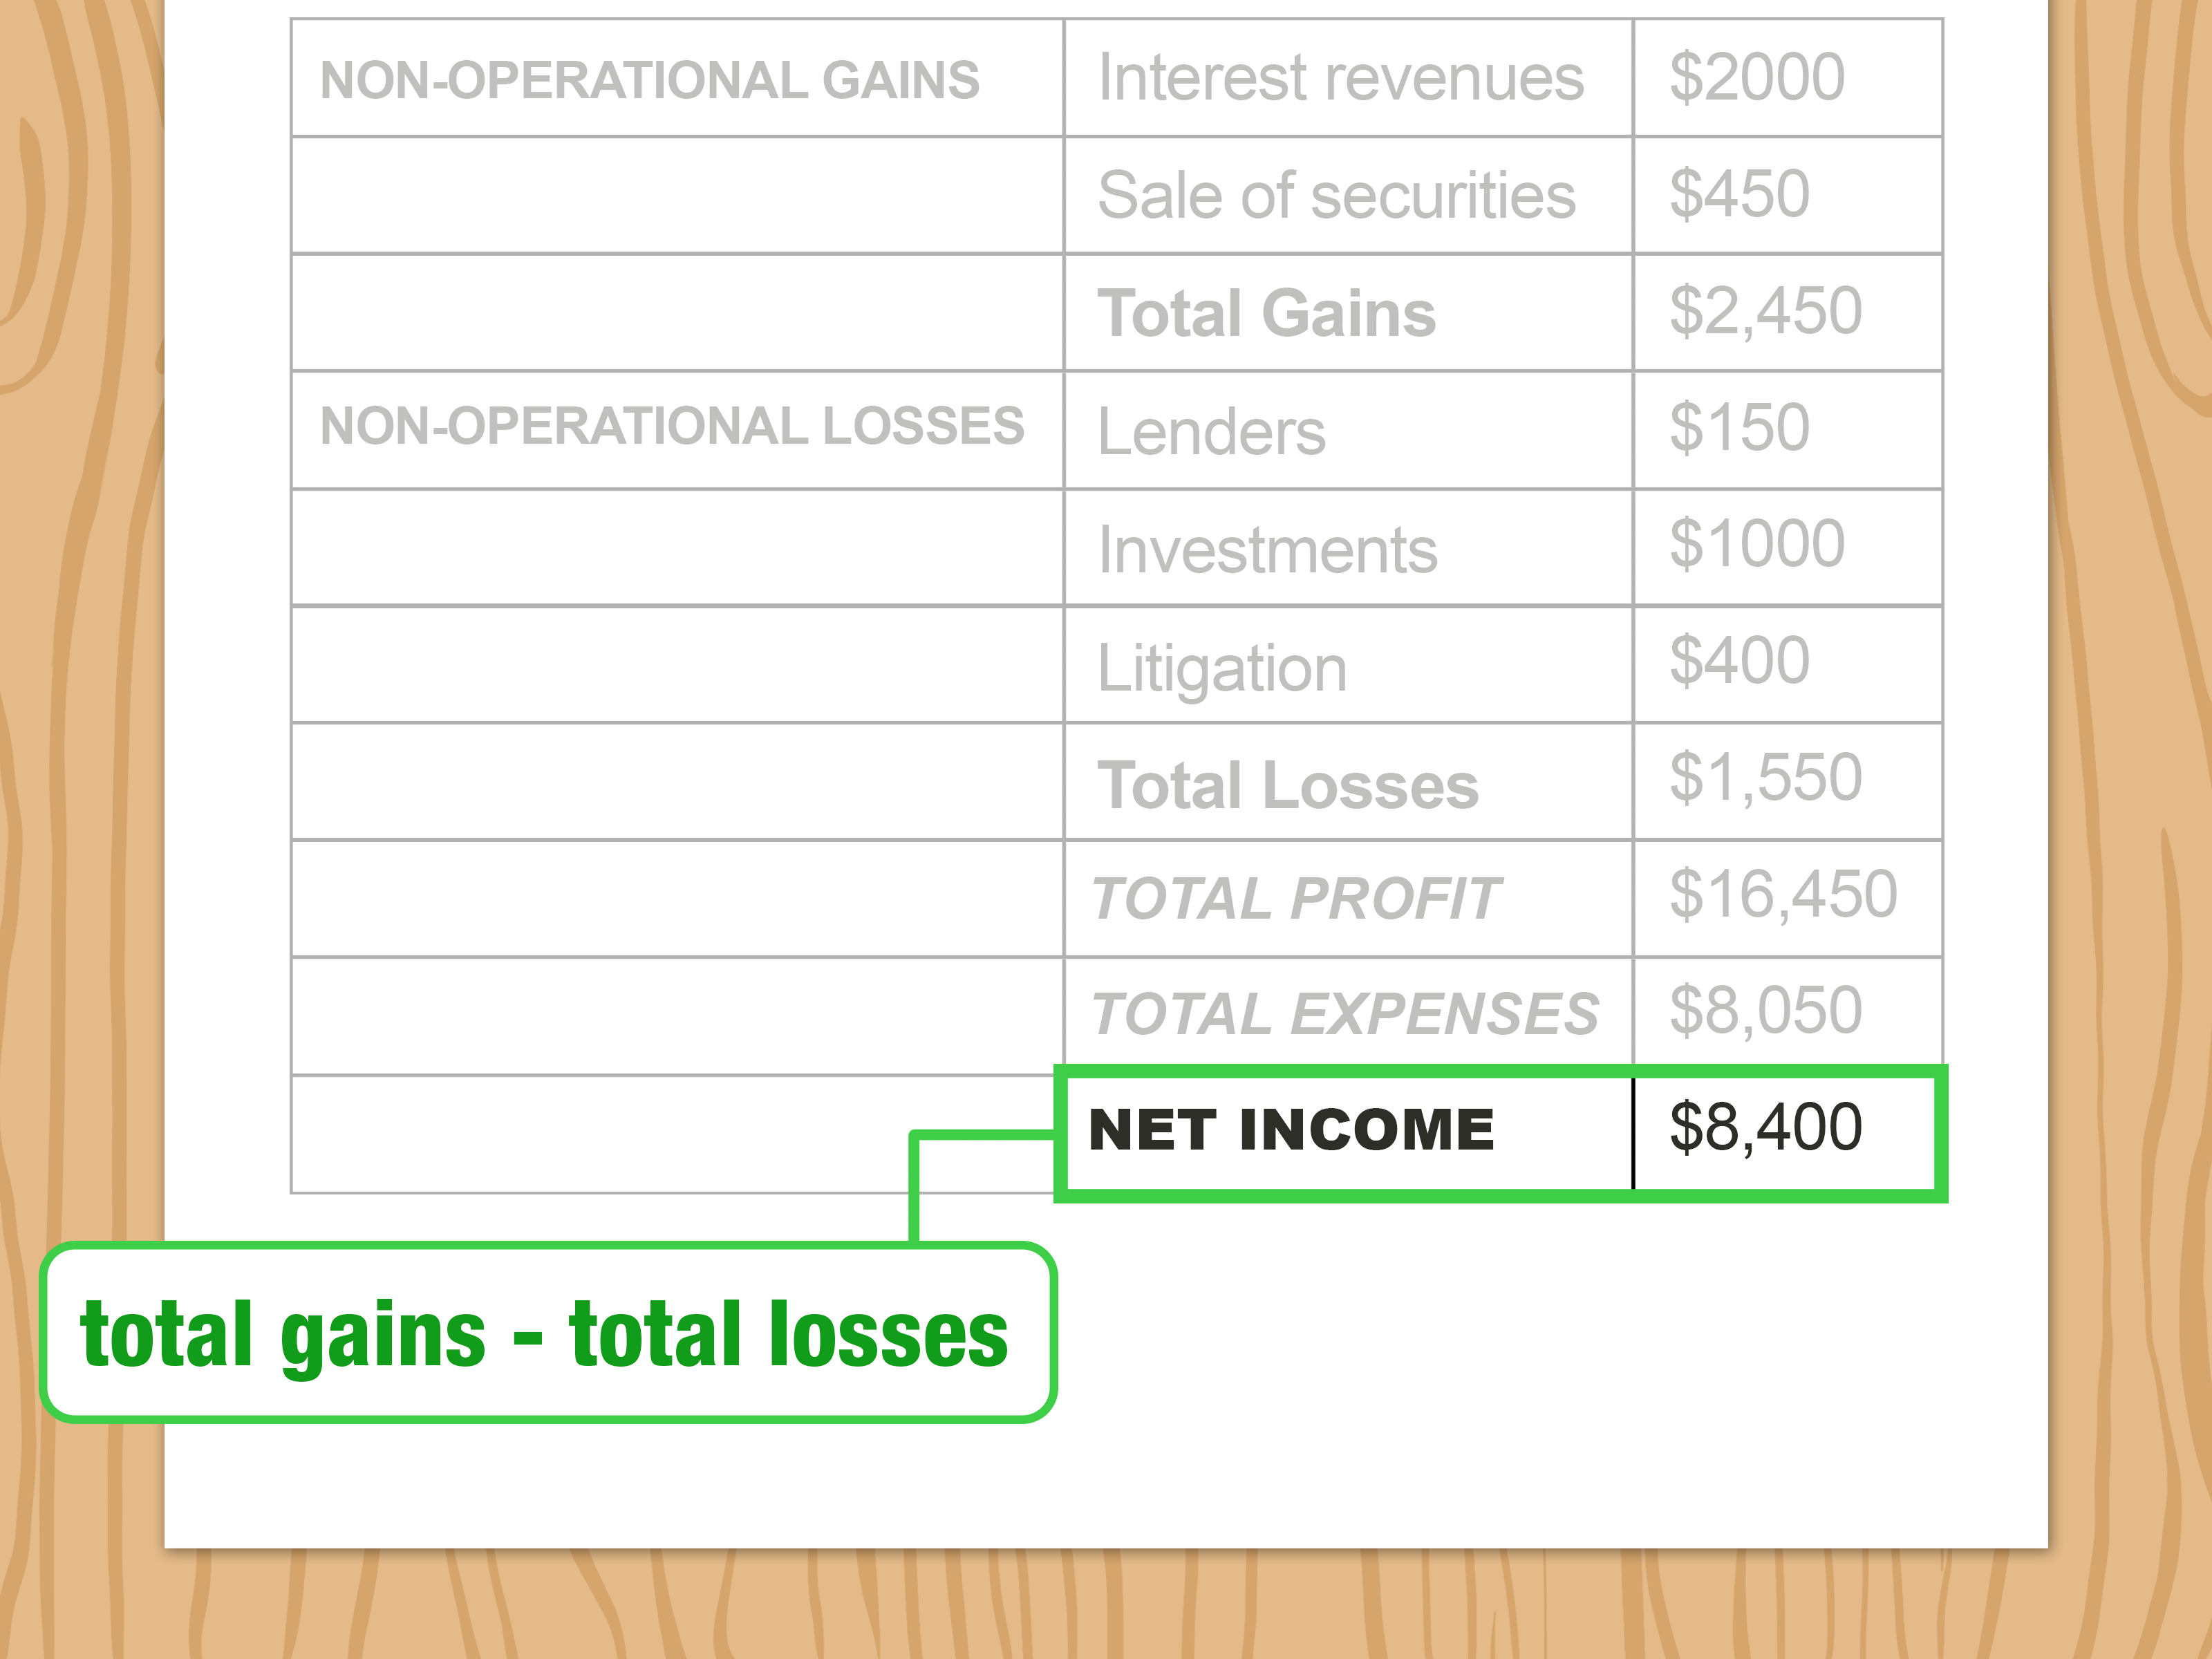
Step 6: Add/Subtract Non-Operating Items
Keep non-operating activity separate so your operating performance stays clear. Common items:
- Interest income
- Interest expense
- Gain/loss on asset sales
- Other one-time or peripheral items
Pre-Tax Income Formula
Pre-Tax Income = Operating Income + Non-Operating Income − Non-Operating Expenses
Step 7: Record Income Tax Expense and Net Income
Apply the appropriate tax treatment for your entity type and period.
Then compute your bottom line:
Net Income Formula
Net Income = Pre-Tax Income − Income Tax Expense
Net income is the headline numberbut never read it alone. Pair it with gross margin and operating margin for a full picture.
Step 8: Build a Clean, Professional Layout
Great statements are readable at a glance. Use this structure:
- Header: Company Name, “Income Statement,” Reporting Period
- Revenue section
- COGS and Gross Profit
- Operating Expenses and Operating Income
- Non-operating section
- Pre-tax Income, Tax Expense, Net Income
Formatting tips:
- Use consistent line item names month to month.
- Round logically (whole dollars or nearest hundred for larger companies).
- Show subtotals clearly (Gross Profit, Operating Income, Net Income).
- Avoid “Miscellaneous” as a black hole category.
Step 9: Add Analytical Ratios (Optional but Smart)
Want your income statement to become a management dashboard? Add these:
- Gross Margin % = Gross Profit / Revenue
- Operating Margin % = Operating Income / Revenue
- Net Margin % = Net Income / Revenue
- Common-size view: each line as % of revenue
Common-size formatting helps you compare periods even when sales volumes change dramatically.
Worked Example: Multi-Step Income Statement
| Line Item | Amount (USD) |
|---|---|
| Net Revenue | 500,000 |
| Cost of Goods Sold | (200,000) |
| Gross Profit | 300,000 |
| Salaries & Benefits | (120,000) |
| Rent & Utilities | (40,000) |
| Marketing | (35,000) |
| Software & Admin | (20,000) |
| Depreciation | (10,000) |
| Total Operating Expenses | (225,000) |
| Operating Income | 75,000 |
| Interest Expense | (8,000) |
| Other Income | 3,000 |
| Pre-Tax Income | 70,000 |
| Income Tax Expense | (14,000) |
| Net Income | 56,000 |
Quick interpretation:
- Gross margin = 300,000 / 500,000 = 60%
- Operating margin = 75,000 / 500,000 = 15%
- Net margin = 56,000 / 500,000 = 11.2%
Common Mistakes (and How to Avoid Them)
1) Mixing Personal and Business Expenses
Fix: Separate accounts and strict bookkeeping rules.
2) Treating Owner Draws as Expenses
Fix: Record draws in equity, not operating expense.
3) Misclassifying COGS vs Operating Expense
Fix: Define direct vs indirect costs in an accounting policy note.
4) Ignoring Accrual Adjustments
Fix: Book receivables, payables, prepaids, and accruals before finalizing.
5) Overusing “Other Expenses”
Fix: Keep categories specific so trends are visible.
6) No Period-to-Period Comparison
Fix: Show current period, prior period, and variance percentage.
Income Statement for Small Business vs Public Company
A small business statement can be lean and practical. A public company statement follows stricter reporting and disclosure standards.
But the core logic is the same: revenue, costs, profitability layers, and clear classification.
For sole proprietors, tax reporting (for example, Schedule C concepts) intersects with P&L structure, but your management income statement should still prioritize clarity and decision usefulness.
How to Make the Process Faster Every Month
- Create a chart of accounts that mirrors your income statement layout.
- Close books on a fixed monthly calendar.
- Use bookkeeping software to automate recurring entries.
- Lock closed periods so prior data doesn’t drift.
- Add a review checklist before publishing numbers.
If your file names currently include IncomeStatement_FINAL_v12_REAL_FINAL, this section is your intervention.
Conclusion
Writing an income statement is not just accounting complianceit is operational intelligence.
When built correctly, it helps you price better, spend smarter, and grow with fewer surprises.
The winning approach is simple: choose the right format, classify revenue and expenses accurately, calculate each subtotal cleanly, and review for consistency every reporting period.
Keep it clear, keep it comparable, and keep it timely.
A well-crafted income statement turns “I think we’re doing fine” into “Here’s exactly why we areor aren’t.”
Experience Notes: What Teams Learn the Hard Way (500+ Words)
Across founders, controllers, freelancers, and small-business finance teams, the same pattern appears: people think the hard part of an income statement is math. It isn’t.
The hard part is classification discipline. Most reporting problems begin when line items are dumped into vague buckets during a busy month.
Three months later, nobody remembers why “Other Expense” exploded, and every strategy meeting starts with detective work.
The practical lesson: define categories early and guard them like your Wi-Fi password.
Another recurring experience is the “profit illusion.” Businesses can show strong top-line growth and still feel constantly cash-starved.
Teams often celebrate revenue spikes before checking gross margin and operating margin. Then reality arrives in the form of high fulfillment costs, ad spend creep, and subscription bloat.
When teams start reviewing gross profit monthlynot yearlythey catch pricing issues faster and reduce emotional decision-making.
Margin visibility changes behavior: discounts become intentional, vendor negotiations get serious, and product mix decisions improve.
Service businesses have their own classic trap: underestimating labor cost structure. On paper, revenue looks healthy.
But when labor is not separated between direct delivery work and overhead/admin work, managers can’t see true profitability by service line.
Once teams split labor properly, they often discover one “popular” service is actually margin-negative.
That single insight can reshape staffing, client selection, and contract terms within one quarter.
Translation: the income statement isn’t just reporting history; it is a map for better choices.
E-commerce operators frequently learn a painful lesson about COGS timing and returns. If returns, shipping adjustments, and inventory changes are posted late, monthly income swings look dramatic and confusing.
Teams may think demand is collapsing when it is really a timing mismatch.
The fix that works in practice is routine: close inventory, book returns consistently, and reconcile fulfillment reports before finalizing the P&L.
Once that rhythm is in place, leadership discussions become less reactive and more strategic.
Startups encounter a different experience curve: they focus intensely on runway and fundraising, but sometimes neglect P&L readability.
Investors and lenders do not just look for growth; they look for coherence.
A clean multi-step statement that explains gross profit, operating expenses, and non-operating items signals maturity.
Even when net income is negative (common in early growth), a well-structured statement shows command of unit economics and financial controls.
Sloppy formatting can make a decent business look risky; clean structure can make a risky period look managed.
Teams also report a major behavior shift after adopting monthly close deadlines. Before deadlines, the income statement is “something we do when we have time.”
After deadlines, it becomes a management routine. Owners start asking sharper questions: Why did marketing rise 18% while revenue rose 6%?
Why is software expense fragmented across five overlapping tools?
Why is gross margin better in direct sales than marketplace channels?
Better questions produce better policies, and better policies produce better statements next month.
One more practical experience: cross-functional review beats finance-only review. When operations, sales, and finance review the income statement together, classification accuracy improves because people closest to transactions explain what actually happened.
Finance learns context; operations learns financial impact.
This shared review reduces finger-pointing and increases accountability.
Over time, teams move from “Who booked this wrong?” to “How do we design cleaner processes so this doesn’t happen again?”
That cultural shift is often the hidden ROI of strong financial reporting.
The biggest takeaway from these real-world patterns is simple: good income statements are built by habits, not heroics.
You do not need exotic formulas. You need consistent categorization, timely close cycles, clear ownership, and disciplined review.
When those habits are in place, your income statement evolves from a static report into a strategic tool.
And that is when finance stops being a back-office function and starts becoming a growth engine.