Ray Dalio’s “1937 scenario” sounds like something a market historian might whisper in a dimly lit room while bond traders clutch their coffee cups. But the idea is not spooky for the sake of being spooky. It refers to a real historical moment when the U.S. economy appeared to be recovering from the Great Depression, policymakers tightened too soon, and markets were remindedrather rudelythat recoveries can trip over their own shoelaces.
For investors, the phrase matters because it connects three uncomfortable themes: strong market rebounds, high debt burdens, and policy mistakes. In the mid-1930s, stocks had already staged a huge recovery from the Great Depression lows. Then came 1937. The economy rolled over, industrial production plunged, unemployment jumped, and stocks suffered one of the sharpest drawdowns in modern U.S. market history. Dalio has used this comparison to warn that when interest rates are low, debt is high, and central banks tighten into a fragile recovery, markets can become vulnerable to a sudden reversal.
This article breaks down what the 1937 scenario means, how market returns behaved, what caused the downturn, and what modern investors can learn without pretending history is a photocopier. Spoiler: history is more like a jazz musician. It repeats themes, but it rarely plays the exact same solo twice.
What Is Ray Dalio’s 1937 Scenario?
Ray Dalio, founder of Bridgewater Associates, is known for studying long-term debt cycles, monetary policy, political conflict, and historical market patterns. His 1937 analogy focuses on a specific setup: after a major debt crisis, central banks push interest rates very low, asset prices recover strongly, and then policymakers begin removing stimulus before the private economy is truly healthy.
In the original 1937 case, the United States was recovering from the Great Depression. Stocks had rallied dramatically from the 1932 lows. Economic output, wages, and profits had improved. Policymakers became worried about inflation, excessive credit, and government deficits. The Federal Reserve raised reserve requirements, the Treasury sterilized gold inflows, and fiscal policy became less supportive. The result was the recession of 1937–1938, often called the “recession within the Depression.”
Dalio’s warning is not simply “stocks fell in 1937, therefore stocks will fall now.” That would be financial astrology wearing a necktie. The deeper point is that markets can become fragile when liquidity is withdrawn after a debt-driven recovery. If asset prices are already high, debt service is heavy, and investors are leaning too confidently into risk, even a modest policy shift can have an outsized market impact.
The Market Backdrop Before 1937
To understand market returns during the 1937 scenario, you have to rewind to the early 1930s. The stock market had collapsed after 1929, banks had failed, deflation had crushed prices, and confidence was lying on the floor like a dropped sandwich. By 1932, however, the market had begun to recover from extreme lows.
From 1933 through 1936, U.S. equities produced extraordinary gains. Historical return data commonly show the S&P 500 rising about 50% in 1933, slipping slightly in 1934, then gaining roughly 47% in 1935 and about 32% in 1936 when dividends are included. That was not a polite recovery. It was a rocket launch from a crater.
This matters because the 1937 decline did not begin from a cheap, depressed market. It began after a large multi-year rebound. Investors who bought near the lows had strong gains, but latecomers were stepping into a market that had already priced in a good deal of recovery. When policy tightened and the economy weakened, the market had plenty of altitude from which to fall.
Market Returns in 1937: The Big Drawdown
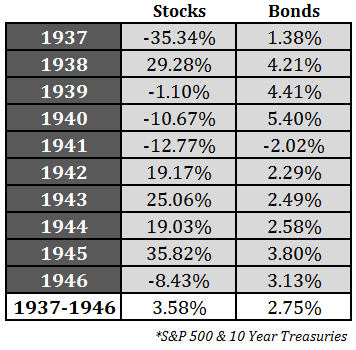
The headline number is brutal: U.S. stocks lost roughly 35% in 1937 on a total-return basis, depending on the dataset used. Some stock price indexes and industrial averages show peak-to-trough declines of more than 40%. Either way, the message is clear: the 1937 scenario was not a mild “take a deep breath” correction. It was a serious bear market.
Using common historical S&P 500 total return data, the sequence looks something like this:
- 1935: Stocks gained roughly 47%.
- 1936: Stocks gained roughly 32%.
- 1937: Stocks fell roughly 35%.
- 1938: Stocks rebounded roughly 29%.
- 1939: Stocks were roughly flat to slightly negative.
That pattern is important. The 1937 scenario was not just “bad year follows good year.” It was a violent unwind after a huge recovery, followed by an equally dramatic rebound once policy turned easier and the economy stabilized. Investors who sold in panic near the trough locked in pain. Investors who ignored the risks before the downturn also got a masterclass in humility, and tuition was not cheap.
Why Did Stocks Fall So Hard?
1. Monetary Tightening Hit a Fragile Recovery
One major explanation for the downturn was monetary tightening. The Federal Reserve doubled reserve requirements in stages during 1936 and 1937. The goal was to prevent banks from creating too much credit. In theory, policymakers were tapping the brakes. In practice, they may have tapped the brakes while driving on a wet mountain road.
Economists debate exactly how much the reserve requirement changes mattered because many banks held excess reserves. However, the broader monetary picture was clearly less friendly. The Treasury’s gold sterilization policy also played a major role. Gold inflows had previously expanded the monetary base, but sterilization prevented those inflows from feeding into the banking system. That meant the monetary base stopped growing at a time when the economy still needed support.
2. Fiscal Policy Became Less Supportive
Fiscal policy also shifted. After years of New Deal spending, the Roosevelt administration became more concerned about deficits. Government spending growth slowed, and new taxes, including Social Security payroll taxes, began to affect incomes. The fiscal pullback may not explain the entire recession, but it added pressure at the wrong time.
Markets care about earnings, liquidity, and confidence. In 1937, all three were hit. Industrial output fell sharply, corporate profits came under pressure, and investors began to question whether the recovery had been real or merely a policy-supported bounce. Once that question entered the room, it did not sit quietly in the corner.
3. Investor Psychology Reversed Quickly
After several years of strong gains, investors were vulnerable to disappointment. This is one of the most timeless lessons of market history: when expectations are low, good news can ignite a rally; when expectations are high, even decent news may not be enough. By 1937, markets had already celebrated recovery. When the economy weakened, the celebration ended fast. The punch bowl was removed, the band stopped playing, and somebody noticed the bill.
How Bonds and Cash Performed
During the 1937 stock market decline, short-term Treasury bills produced small positive returns, while longer-term government bonds also delivered positive but modest returns in many historical datasets. In common return tables, 3-month Treasury bills returned around 0.3% in 1937, while 10-year Treasury bonds returned a bit above 1%.
That may sound boring, but boring can be beautiful when stocks are down 35%. In a severe equity drawdown, capital preservation becomes its own form of performance. Investors often learn this lesson right after they wish they had learned it earlier.
However, the 1937 case also reminds investors that bonds are not magic shields. Their performance depends on inflation, interest rates, starting yields, and policy conditions. In a deflationary or disinflationary downturn, high-quality bonds can help. In an inflationary crisis, the story can be very different. Dalio’s broader framework often emphasizes diversification across environments precisely because one asset class cannot solve every macro problem.
The 1938 Rebound: Why the Market Snapped Back
After the 1937 collapse, stocks rebounded strongly in 1938. Historical total return data commonly show U.S. equities gaining around 29% that year. The recovery came as policymakers reversed course. Reserve requirements were reduced, gold sterilization ended, and fiscal policy became more expansionary. Industrial production recovered, and investors began to price in stabilization.
This is the part of the 1937 scenario that investors sometimes overlook. The market fell hard, but it did not fall forever. Once liquidity conditions improved and economic contraction eased, equities responded quickly. That does not make the drawdown painless, but it does show why panic selling during historical crises can be dangerous.
In simple terms, the 1937–1938 pattern looked like this: liquidity was removed, stocks crashed; liquidity returned, stocks rallied. The market was not voting on morality, elegance, or whether policymakers had nice handwriting. It was reacting to money, earnings, and expectations.
What Dalio’s 1937 Scenario Means for Modern Investors
Dalio’s modern concern is that a similar pattern can appear after any major debt crisis. The economy weakens, central banks cut rates, governments borrow heavily, and asset prices recover. Then, if inflation rises or policymakers fear bubbles, they tighten policy. If debt burdens are high and markets are expensive, tightening can expose hidden fragility.
The modern version does not need to match 1937 perfectly. Today’s economy has different institutions, floating exchange rates, deposit insurance, deeper capital markets, and a Federal Reserve that studies the Great Depression like a student who really does not want to fail the final exam. Still, the broad risk remains: when financial markets depend heavily on easy money, removing that money can change the weather quickly.
Key Similarities Investors Watch
- Strong asset gains after a major crisis.
- High debt levels across government, households, or corporations.
- Low or previously low interest rates encouraging risk-taking.
- Policy tightening after a long period of stimulus.
- Political tension and rising distrust in institutions.
- Expensive valuations that leave little room for disappointment.
Key Differences From 1937
There are also major differences. The U.S. is no longer operating under the same gold-linked monetary regime. The Federal Reserve has more tools, including forward guidance, emergency lending programs, and large-scale asset purchases. The financial system is broader and more global. Automatic stabilizers, such as unemployment insurance and federal transfer payments, are larger than they were in the 1930s.
That means investors should not treat 1937 as a market prophecy. It is better understood as a stress test. The question is not, “Will the market repeat 1937?” The better question is, “What happens to my portfolio if policymakers tighten into weakness and risk assets reprice sharply?”
Portfolio Lessons From the 1937 Scenario
Diversification Is Not Decorative
Diversification is often treated like a polite investing slogan, right up there with “think long term” and “please stop checking your portfolio every nine minutes.” But in a 1937-style downturn, diversification becomes practical. Stocks can fall quickly when liquidity tightens. Cash, short-term bills, high-quality bonds, commodities, inflation hedges, and international assets may behave differently depending on the macro environment.
Valuation Matters Most When Liquidity Changes
High valuations do not cause markets to fall by themselves. Expensive markets can get more expensive, which is why shorting every high-priced market is a great way to become historically correct and financially miserable. But valuation matters when the liquidity backdrop changes. In 1937, stocks had already climbed sharply. When policy tightened and growth weakened, the margin for error disappeared.
Policy Timing Can Dominate Earnings Narratives
Investors love company stories: better products, wider margins, heroic CEOs, and earnings calls filled with phrases like “operational excellence.” But in macro-driven episodes, policy timing can overpower micro narratives. In 1937, even good companies were dragged down by a tightening financial environment and falling demand. In a Dalio-style scenario, the macro tide matters.
Rebounds Can Be Fast After Policy Reversal
The 1938 rebound shows that markets can recover quickly when policy shifts. This is why investors should plan before the crisis. If your strategy depends on making calm decisions while markets are falling 30%, congratulations, you have designed a strategy for a robot. Humans need rules, rebalancing plans, cash buffers, and realistic expectations before volatility arrives.
Market Returns During the 1937 Scenario: A Practical Example
Imagine an investor who placed $10,000 into a broad U.S. stock portfolio at the start of 1935. After a gain of about 47% in 1935, the portfolio would have grown to roughly $14,700. After another gain of about 32% in 1936, it would have reached around $19,400. Wonderful. Champagne? Perhaps. But then 1937 arrived with a decline of about 35%, cutting the portfolio to around $12,600.
That investor was still ahead of the original $10,000, but the emotional experience would have been awful. A large paper gain disappeared in a single year. Then, with a 1938 rebound near 29%, the portfolio would have recovered to roughly $16,300. The lesson is subtle but powerful: returns depend heavily on starting point, sequence, and behavior. The same market can reward patient early investors, punish late-cycle enthusiasm, and torture anyone who confuses recent gains with permanent safety.
Experience-Based Insights: Living Through a 1937-Style Market Mindset
Investors do not experience a 1937-style scenario as a neat chart in a textbook. They experience it as headlines, uncertainty, arguments, and the slow realization that yesterday’s winning strategy may not work tomorrow. The emotional pattern is often the same. First comes confidence. Asset prices rise, commentators explain why the good times are justified, and skeptics look like people who brought umbrellas to a picnic. Then comes policy tightening or a liquidity shock. At first, investors call it a pullback. Then they call it a correction. Then, after enough damage, they call it “a valuable long-term lesson,” which is investor language for “ouch.”
One practical experience from studying historical downturns is that risk usually feels lowest near the point where it is actually highest. Before 1937, the market had already recovered dramatically. The improving economy made optimism seem reasonable. That is exactly why the setup was dangerous. When everyone can explain why prices have risen, fewer people ask what could go wrong. A healthy investment process keeps asking that question, not because pessimism is fun, but because math has a habit of showing up uninvited.
Another experience is that cash feels useless until it becomes useful. During strong bull markets, cash looks lazy. It sits there earning little, while stocks do the financial equivalent of sprinting uphill. But when markets fall sharply, cash becomes flexibility. It allows investors to rebalance, buy assets at lower prices, meet personal expenses, and avoid forced selling. In a 1937-style scenario, the investor with liquidity has choices. The investor without liquidity has stress, and stress is not an asset class.
A third experience is that macro analogies are helpful only when used with humility. Comparing today to 1937 can sharpen thinking, but it should not become a rigid forecast. The world changes. Policy tools change. Market structure changes. Investor positioning changes. The goal is not to predict an exact replay; it is to identify vulnerabilities. If a portfolio can survive a policy mistake, a growth scare, and a valuation reset, it is probably more robust than one built only for sunny weather.
The final experience is behavioral. Many investors say they are long-term thinkers, but a severe drawdown tests whether that is a philosophy or just a sentence they enjoy saying. A 1937-style decline forces investors to choose between plan and panic. The best time to make that choice is before the market demands an answer. Written rules for rebalancing, position sizing, emergency cash, and maximum risk exposure can turn chaos into a checklist. It will not make volatility pleasant. Nothing makes a 35% stock decline pleasant, unless you are a short seller with excellent timing and suspiciously calm eyebrows. But preparation can make volatility survivable.
Conclusion
Market returns during Ray Dalio’s 1937 scenario show how quickly a powerful recovery can reverse when policy tightens into a fragile economy. The historical record is clear: after huge gains in the mid-1930s, U.S. stocks fell roughly 35% in 1937, while the broader economy suffered a severe recession. Industrial production plunged, unemployment rose, and investors discovered that liquidity is not background musicit is often the band.
The 1938 rebound also matters. Once policy turned easier and economic conditions stabilized, stocks recovered strongly. That makes the 1937 scenario both a warning and a lesson in discipline. Investors should respect debt cycles, watch policy shifts, avoid overconfidence after large rallies, and build portfolios that can withstand more than one economic weather pattern.
Note: Historical return figures vary slightly by index construction, dividend treatment, and data provider. The article uses widely cited U.S. stock, bond, recession, and economic history data to present practical investment analysis, not personalized financial advice.